Bracket Template
Organize ideas, entities, or teams in a competitive manner and streamline decision-making.
About the Bracket Template
The Bracket Template is a unique visualization tool that stands out among many others. Its structure and purpose are designed to help organize and rank ideas, teams, or topics in a sequential and competitive manner. This tool is essential for decision-making, prioritization, or even some fun team activities.
What's a bracket template?
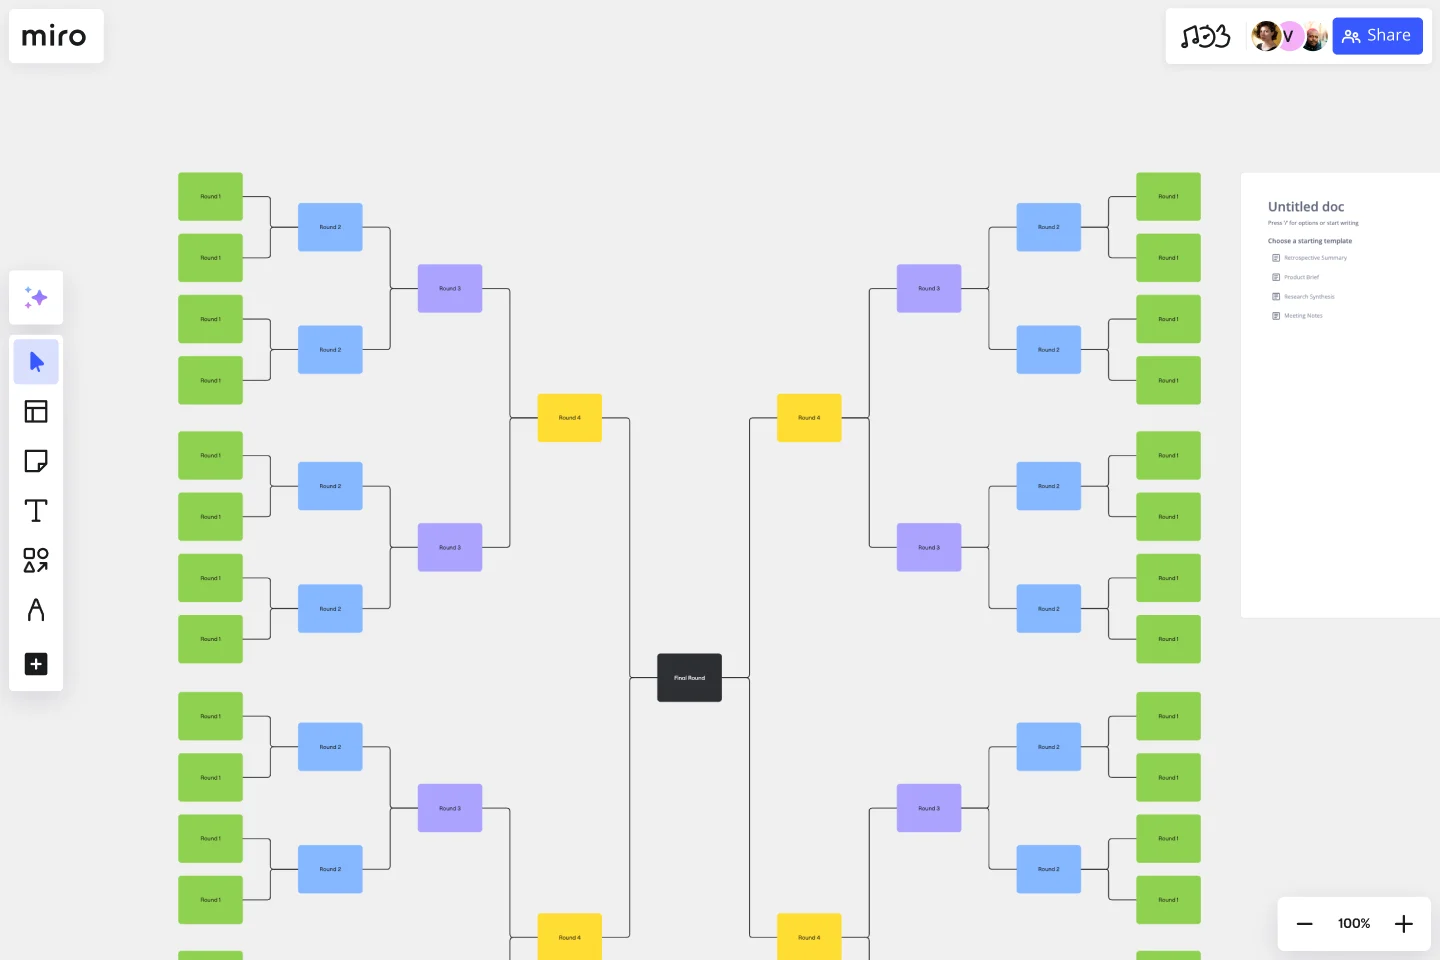
A Bracket Template is a visual representation structured in the shape of a tree, where individual entities or ideas start on either side of the diagram and face off against each other in successive rounds until a winner emerges. Each area of the template comprises:
First seeding sections: The initial placement of entities or ideas. It’s where the competition or comparison begins.
Match-up areas: These show which entities or ideas are competing against each other in each round.
Progression lines: These connector lines indicate who moves forward in the bracket after each decision or result.
Winner's circle: Located at the end of the template, it celebrates the final entity or idea that emerges victorious.
To use it, place your initial ideas or teams in the seeding sections, and as decisions are made, move or mark the progressing entity to the next round until you reach a final conclusion.
How to use the bracket template in Miro
Once on the board, you'll find it's a breeze to edit the template. With just a few clicks, adjust the names, colors, and shapes to suit your needs.
Want to expand? Use automated diagramming features to add more shapes and connector lines, ensuring the template scales with your needs.
Feel free to incorporate any artifact on the board, whether it's notes, images, or links, enriching the context and information of your bracket.
Why use a bracket template?
Structured decision-making: It helps streamline and organize complex decisions by breaking them down into smaller, manageable comparisons.
Engagement: The visual nature and competitive setup foster participation and engagement among stakeholders.
Clarity: It provides a clear visual pathway of progression, making it easier to understand the decision-making process.
Versatility: Suitable for various scenarios, from business decision-making, product prioritization, to fun team-building exercises.
Historical record: The completed template can serve as a visual record of decisions made, offering insights for future reference.
Can I customize the number of seeding sections?
Absolutely. The template is designed to be flexible. You can expand or reduce the number of seeding sections based on your requirements.
Is it possible to use the Bracket Template for non-competitive scenarios?
Yes. While traditionally used for competitive scenarios, the bracket template can be adapted for any situation where structured decision-making or organization is beneficial.
Are there any collaboration features available with the Bracket Template?
Stakeholders can comment, provide feedback, and participate in real-time, making the decision-making process collaborative and inclusive.
Get started with this template right now.
Mind Map Template
Works best for:
Planning, Mind Mapping, Education
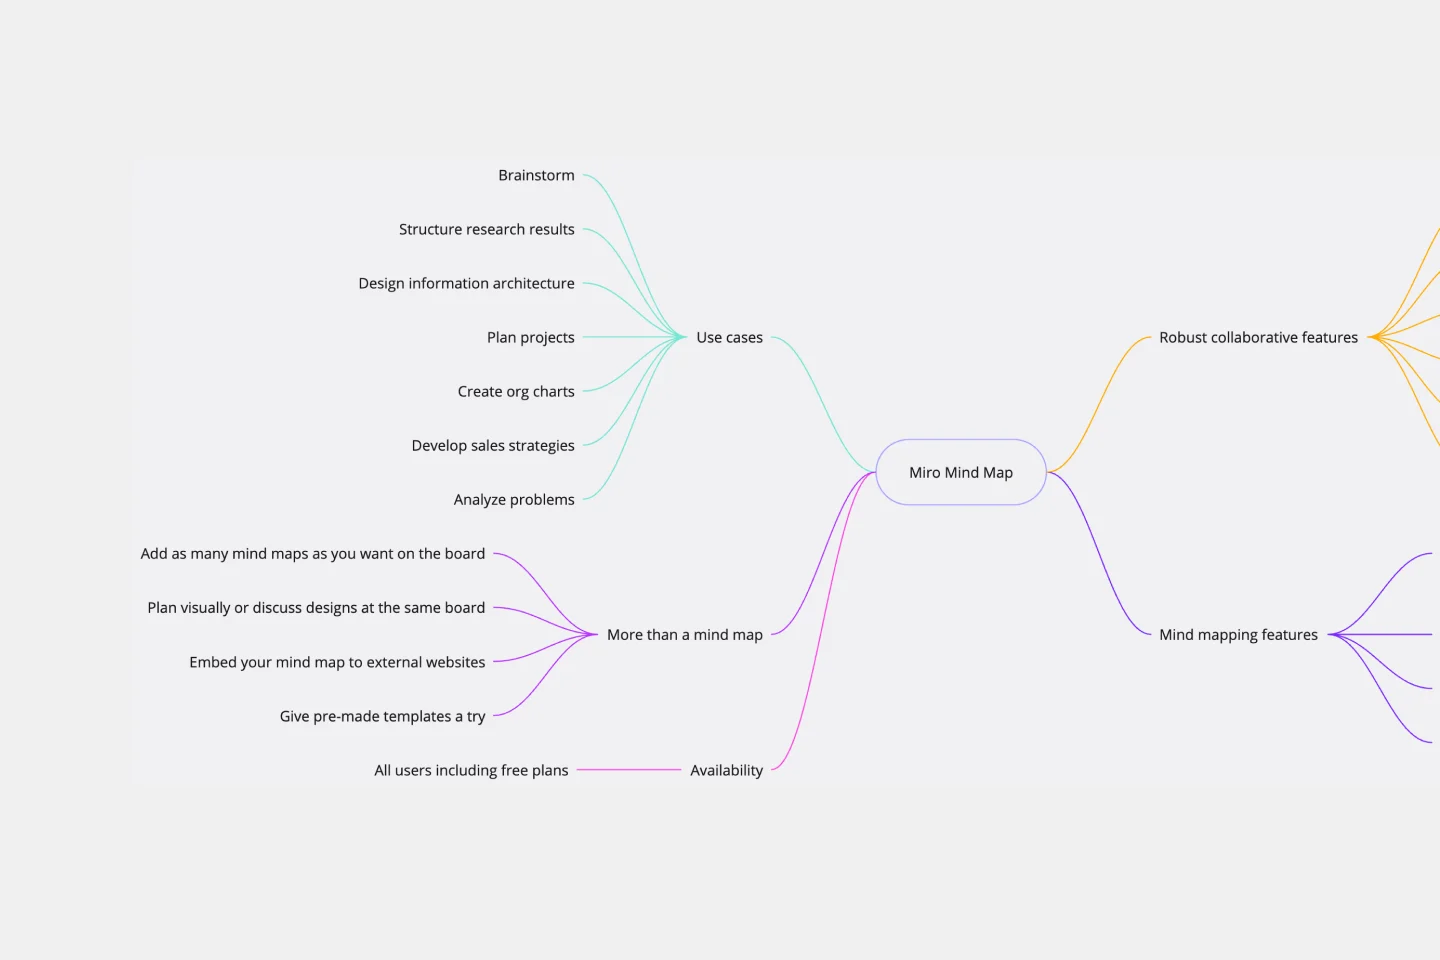
We see you, visual learners. You grasp concepts and understand data easier when they're presented in well-organized, memorable graphics. Mind mapping is perfect for you. This powerful brainstorming tool presents concepts or ideas as a tree — with the central subject as the trunk and your many ideas and subtopics as the branches. This template is a fast, effective way for you to start mind mapping, which can help you and your team become more creative, remember more, and solve problems more effectively.

Entity Relationship Diagram Template
Works best for:
Flowcharts, Strategic Planning, Diagrams
Sometimes the most important relationships in business are the internal ones—between the teams, entities, and actors within a system. An entity relationship diagram (ERD) is a structural diagram that will help you visualize and understand the many complex connections between different roles. When will an ERD come in handy? It’s a great tool to have for educating and onboarding new employees or members of a team, and our template makes it so easy to customize according to your unique needs.
Influence Diagram Template
Works best for:
Business Management, Decision Making, Diagrams
See the big picture of any business decision with this Influence Diagram Template. You’ll define the decision you have to make and brainstorm everything that could impact it. When you build connections between these factors, you’ll be able to put the right amount of weight into each one as you make your decision.
UML Class Diagram Template
Works best for:
UML Class Diagram Template, Mapping, Diagrams
Get a template for quickly building UML class diagrams in a collaborative environment. Use the UML class diagram template to design and refine conceptual systems, then let the same diagram guide your engineers as they write the code.