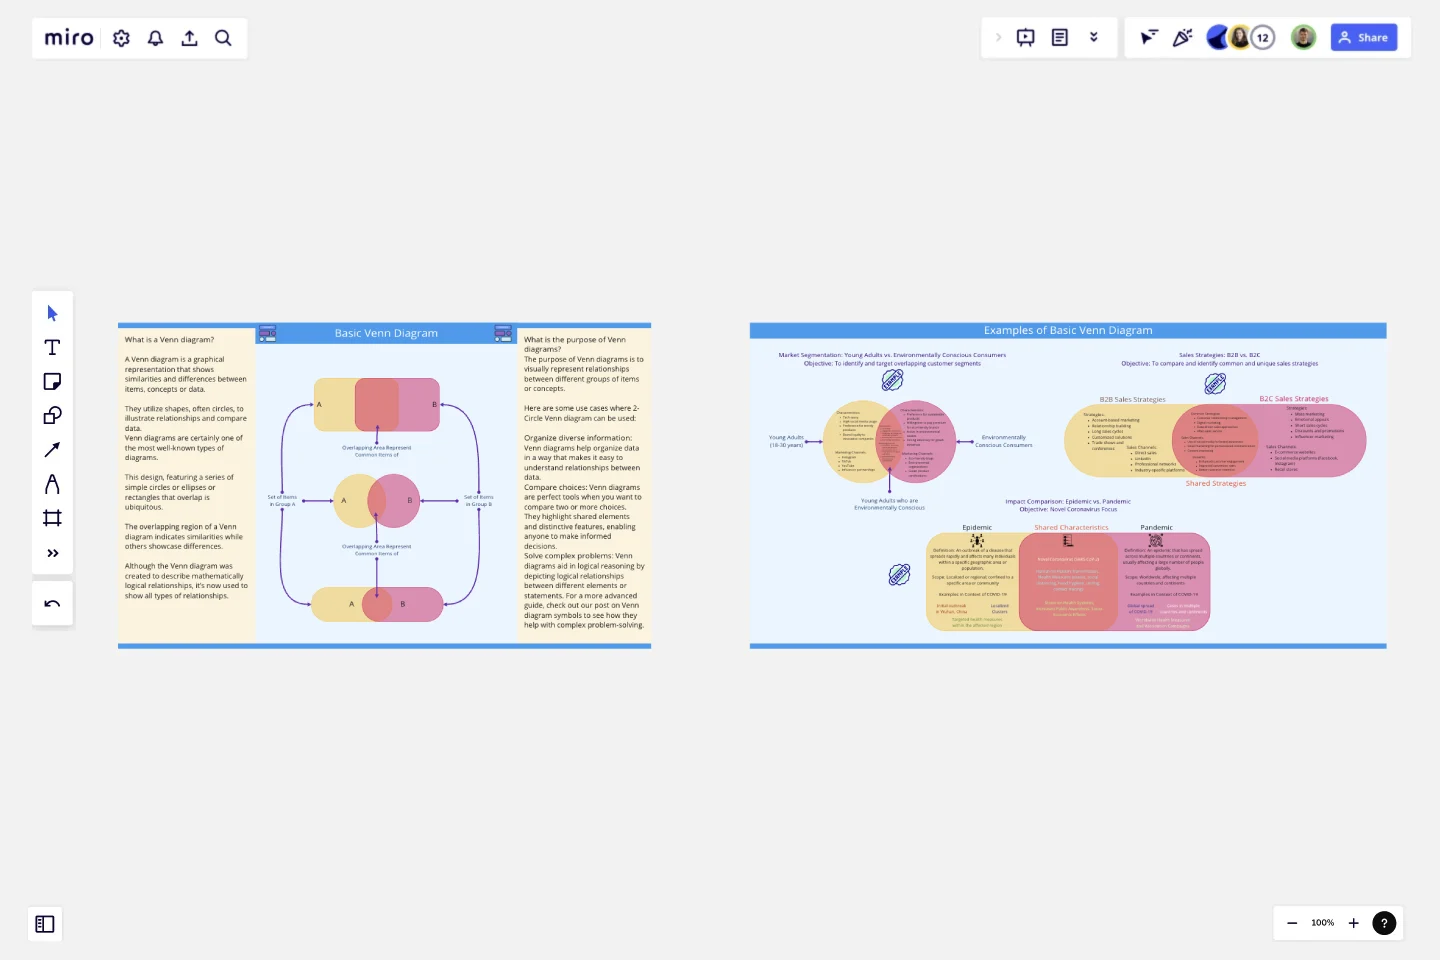
Basic Venn Diagram
A Venn diagram is a graphical representation that shows similarities and differences between items, concepts or data.
Overview
A Venn diagram is a graphical representation that shows similarities and differences between items, concepts or data. They utilize shapes, often circles, to illustrate relationships and compare data.
Venn diagrams are certainly one of the most well-known types of diagrams. This design, featuring a series of simple circles or ellipses or rectangles that overlap is ubiquitous. The overlapping region of a Venn diagram indicates similarities while others showcase differences.Although the Venn diagram was created to describe mathematically logical relationships, it’s now used to show all types of relationships.
Purpose of Venn diagrams?
The purpose of Venn diagrams is to visually represent relationships between different groups of items or concepts.
Here are some use cases where 2-Circle Venn diagram can be used:
Organize diverse information: Venn diagrams help organize data in a way that makes it easy to understand relationships between data.
Compare choices: Venn diagrams are perfect tools when you want to compare two or more choices. They highlight shared elements and distinctive features, enabling anyone to make informed decisions.
Solve complex problems: Venn diagrams aid in logical reasoning by depicting logical relationships between different elements or statements. For a more advanced guide, check out our post on Venn diagram symbols to see how they help with complex problem-solving.
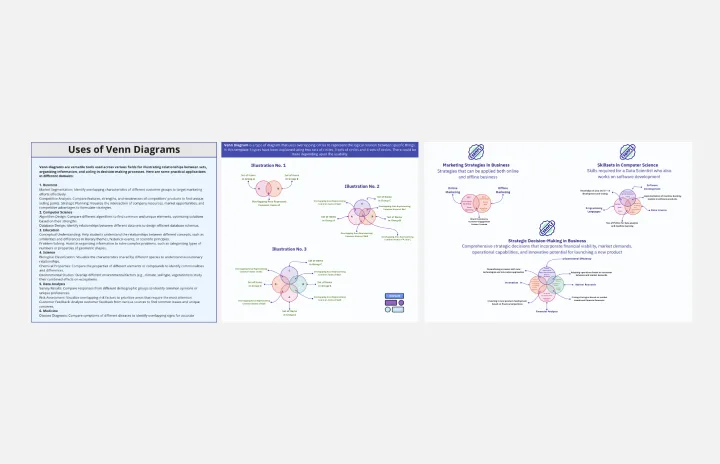
Use this template to create basic level venn diagrams comprising two circles or any other shape. Three examples are also given in this template, which you can use or learn to create your venn-diagrams.
Good luck,
Khawaja Rizwan
Get started with this template right now.
Venn Diagram Practical Applications
Works best for:
Venn Diagram
The Venn Diagram for Practical Applications template helps you apply Venn diagrams to real-world scenarios. Use this template to solve problems, identify relationships, and make decisions based on clear visual analysis. It's perfect for practical tasks such as project planning, resource allocation, and strategic decision-making. This tool is ideal for business professionals, educators, and anyone looking to apply theoretical concepts to practical situations.
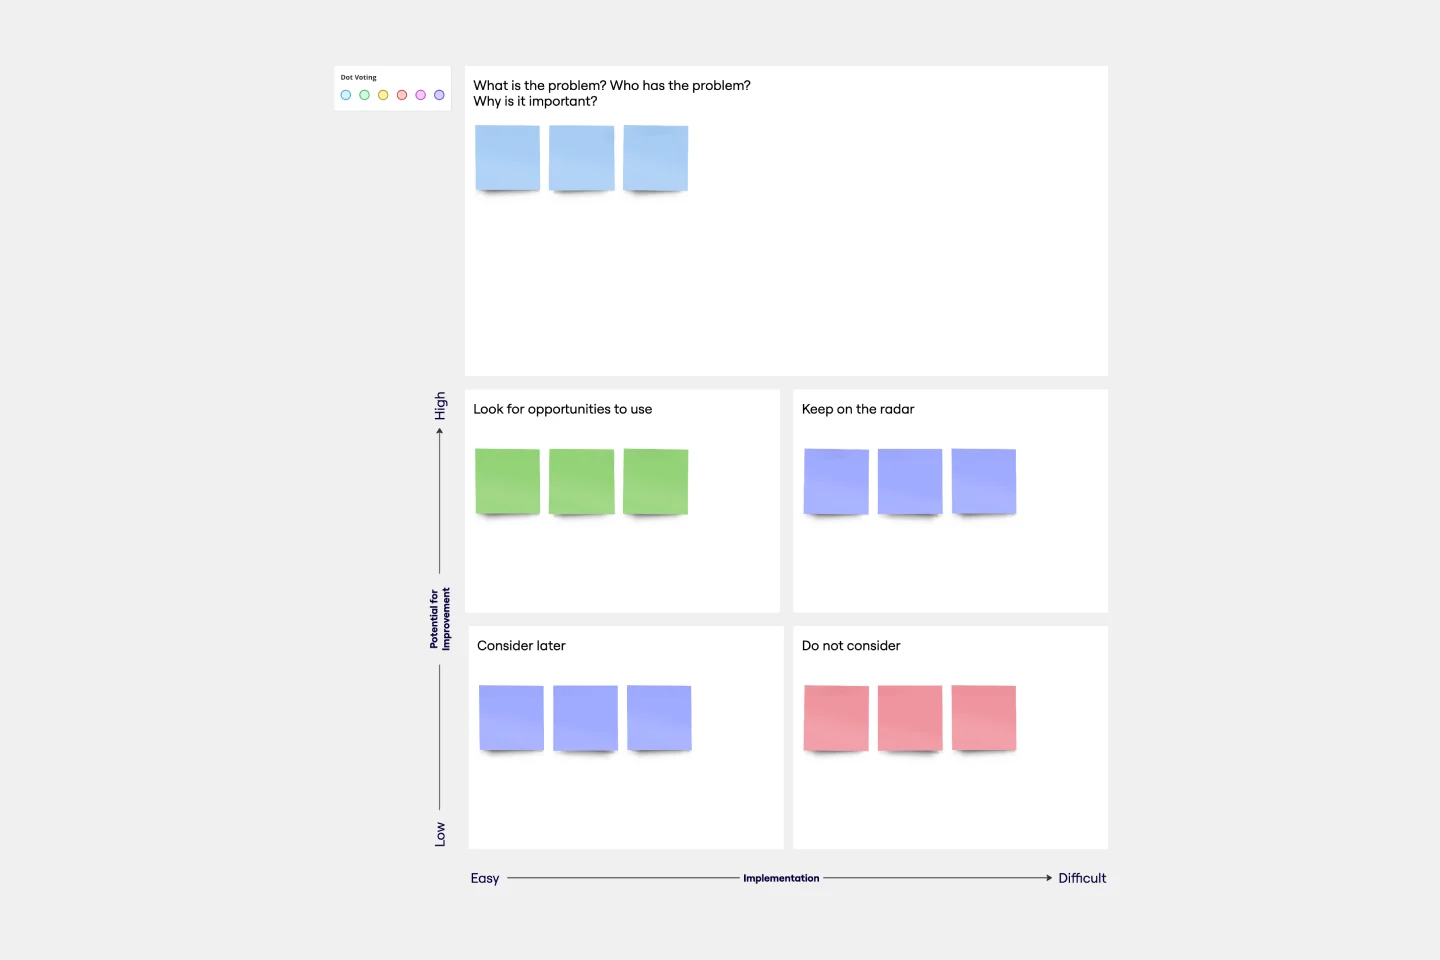
Parking Lot Matrix Template
Works best for:
Project Management, Ideation, Meetings
When the creative energy is flowing, a workshop or meeting will yield a lot of new ideas — but not all are on-topic or currently feasible. Roll them right onto a parking lot matrix, a simple, effective tool for separating the best ideas from those that are promising but could use more research or discussion. This template will let you easily make your own parking lot matrix, which will come in especially handy during long meetings (and when you have teammates who tend to go off-topic).
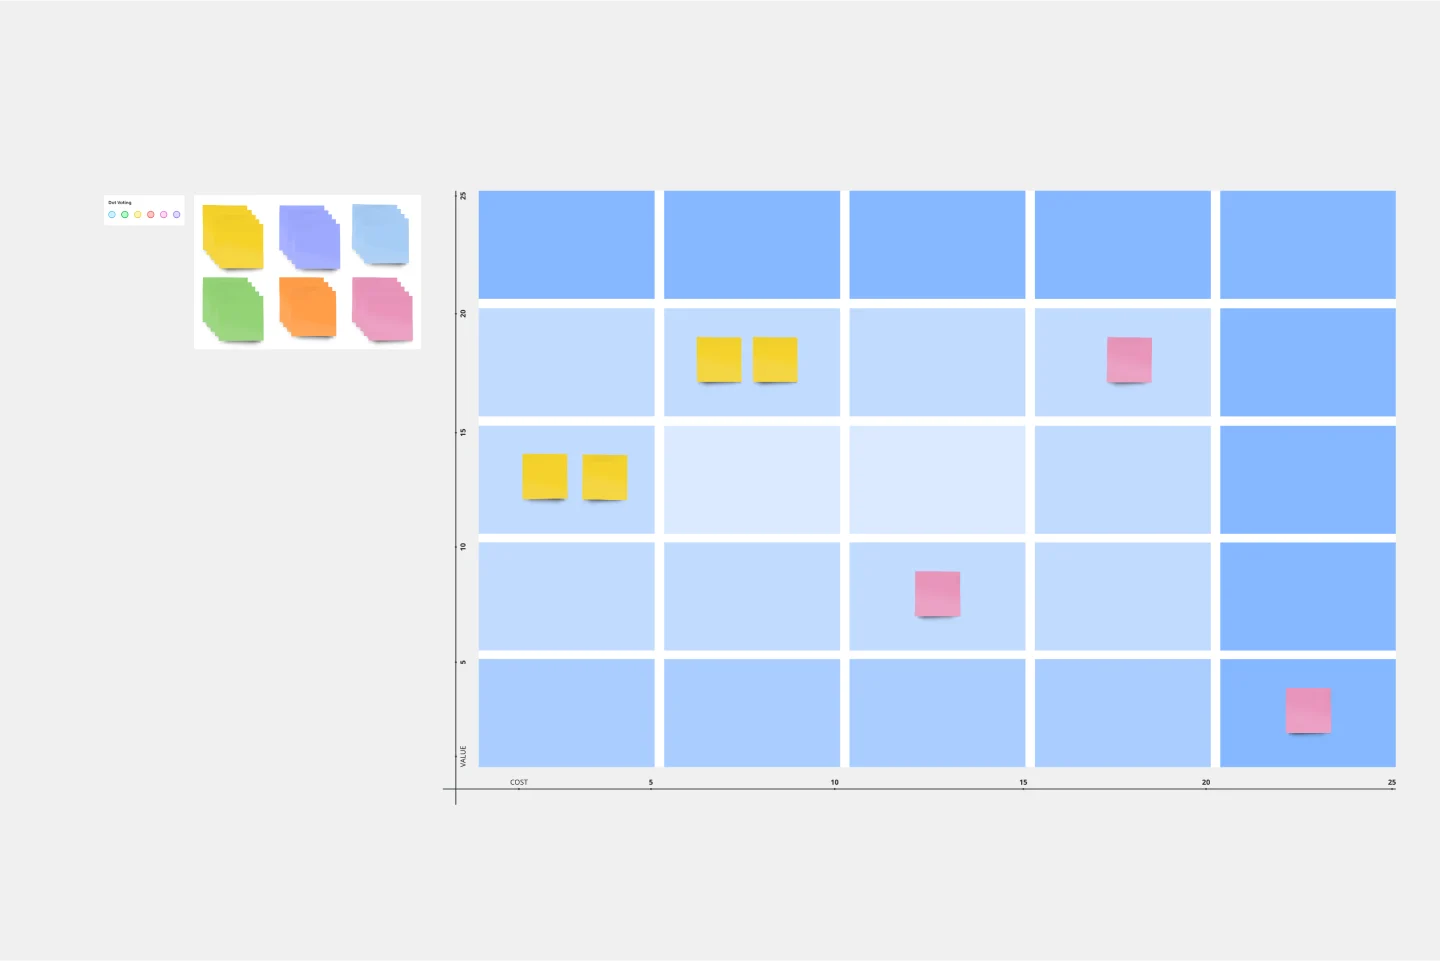
Bang for the Buck Template
Works best for:
Project Management, Strategic Planning, Prioritization
The name pretty much says it—this Agile framework is all about helping you maximize efficiency by powering collaboration between product managers and dev teams. Together you can go over each to-do on the project agenda and evaluate them in terms of costs and benefits. That way you can prioritize tasks based on how much bang for your buck they deliver. This template is great for teams and organizations that want to make a strategic plan to tackle an upcoming sprint.
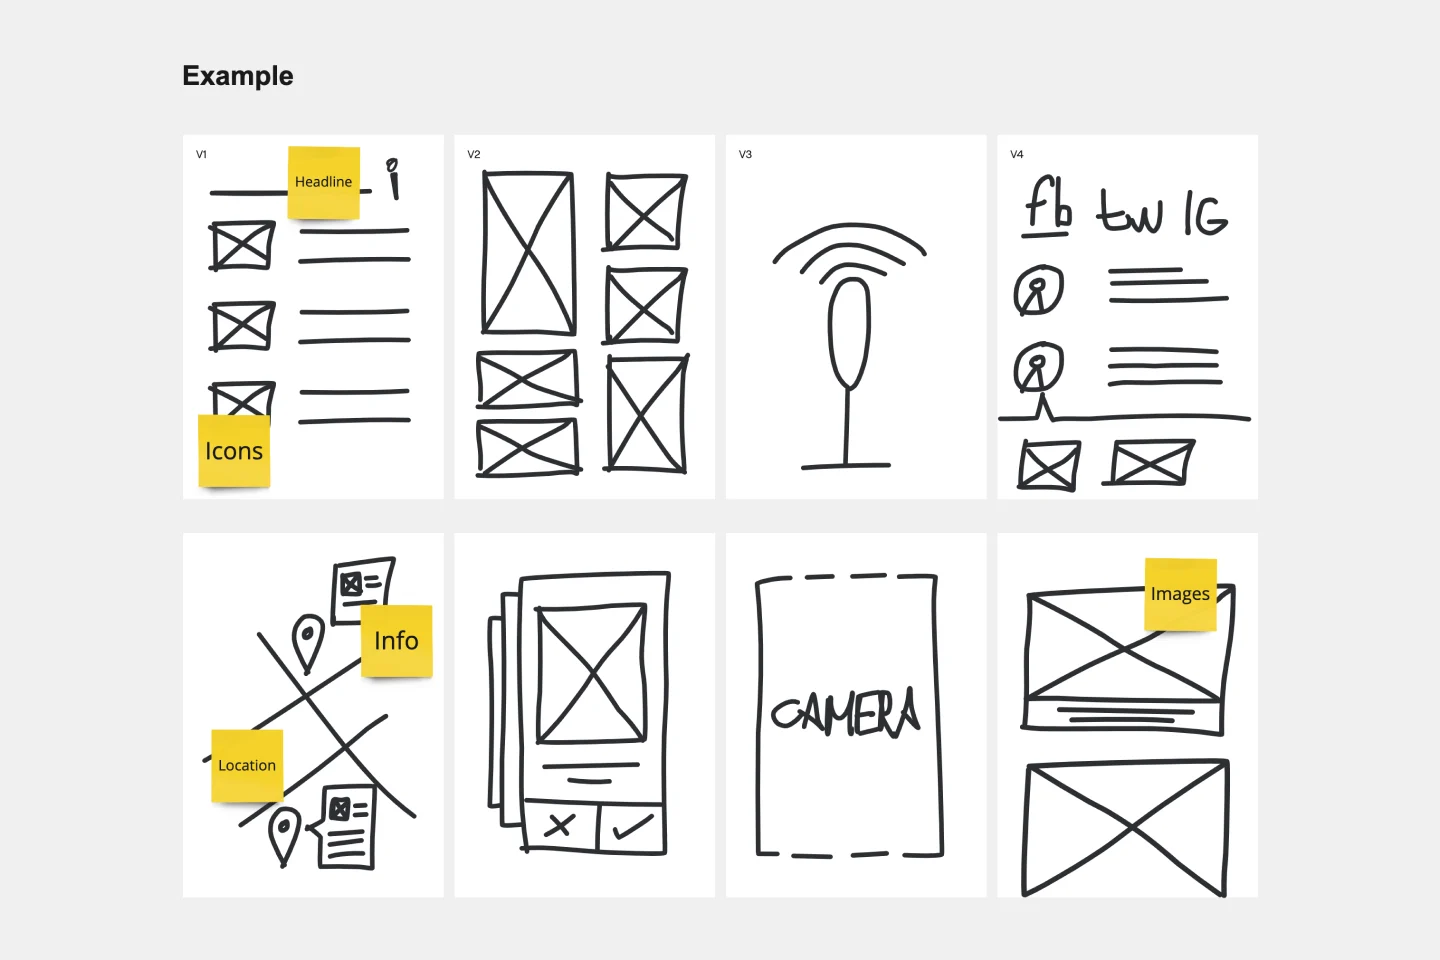
Crazy Eights Template
Works best for:
Design Thinking, Brainstorming, Ideation
Sometimes you just need to get the team’s creative juices flowing for a brainstorm—and get them thinking of as many ideas as they can, as fast as they can. Crazy Eights will do it in a hurry. Favoring quantity over quality, this sketch brainstorming exercise challenges them to come up with eight ideas in eight minutes, which leaves no time to second guess ideas. It’s perfect for early stages of development, and it’s a team favorite for being fast paced and fun.
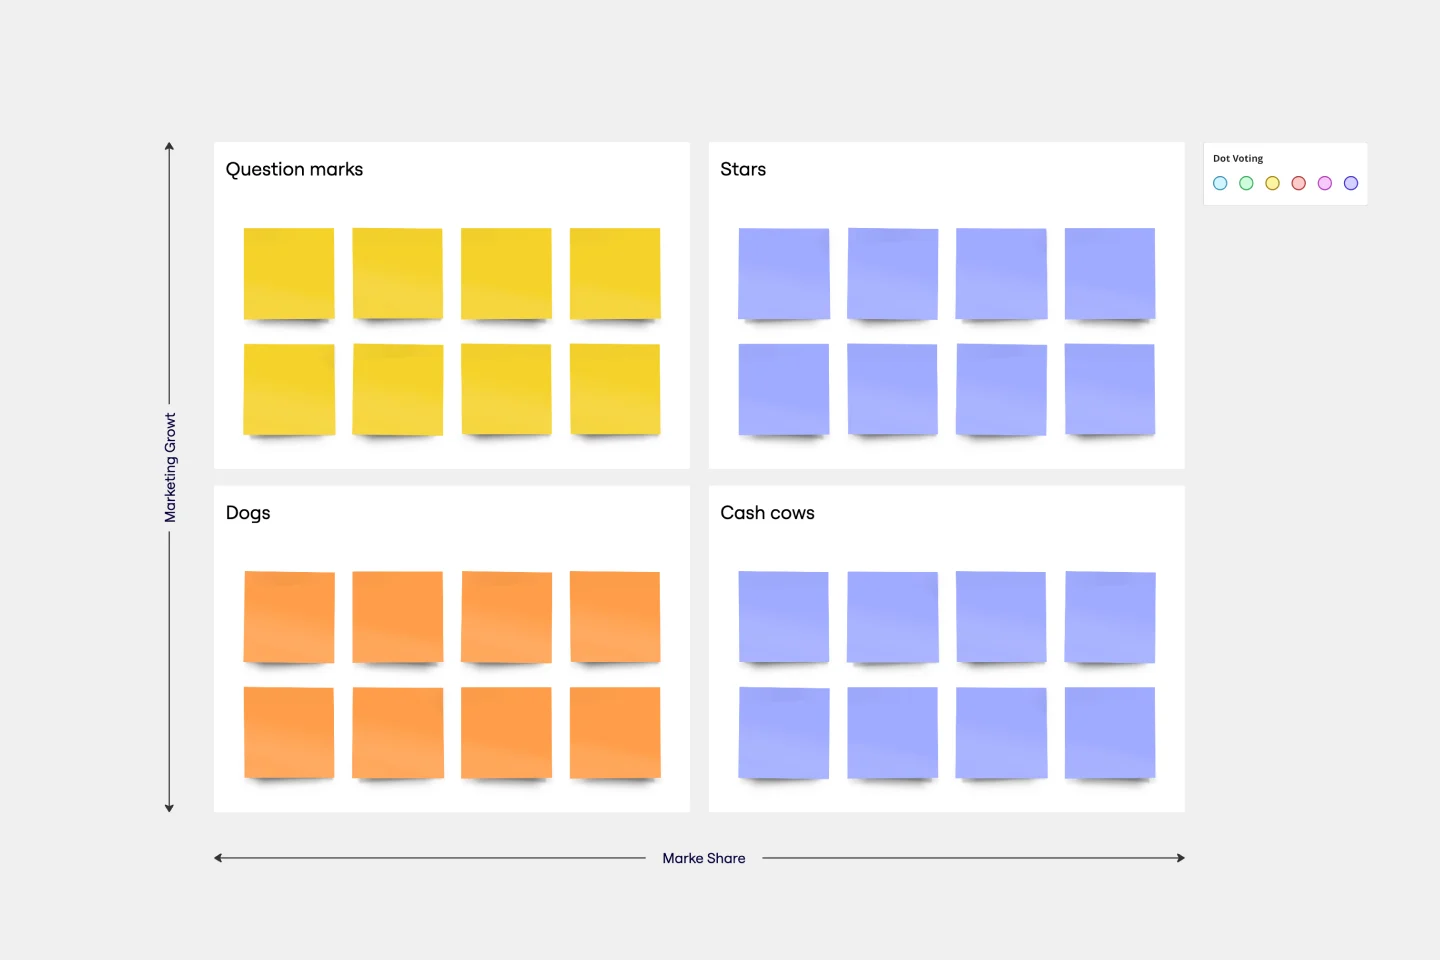
BCG Matrix Template
Works best for:
Strategic Planning
Use the BCG matrix template to make informed and strategic decisions about growth opportunities for your business. Assign your portfolio of products to different areas within the matrix (cash cows, dogs, question marks, stars) to prioritize where you should invest your time and money to see the best results.
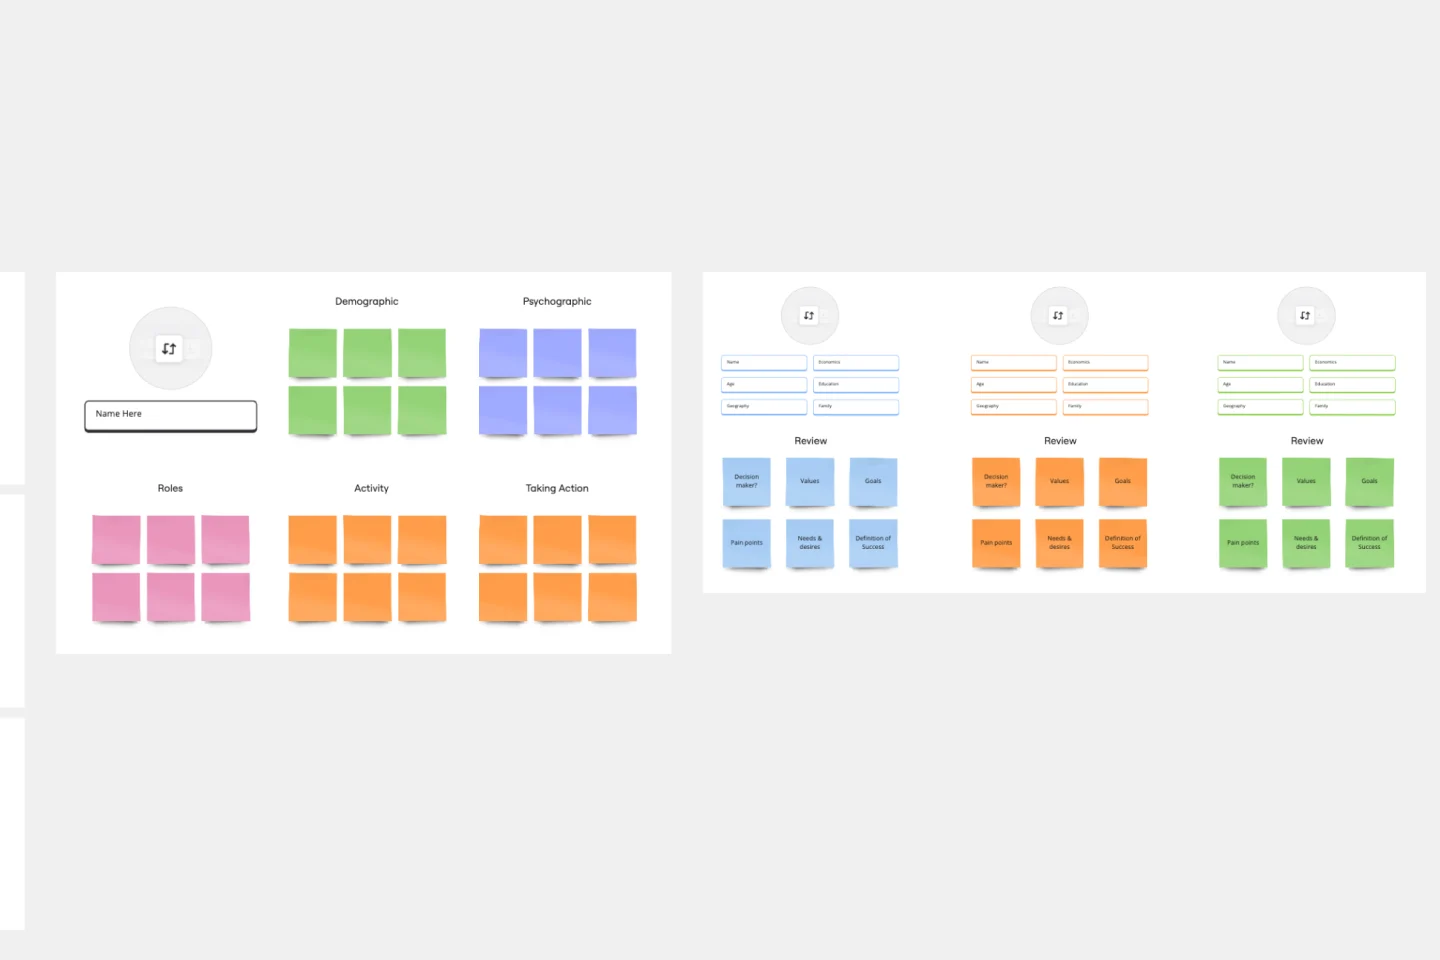
Target Audience Template
Works best for:
Marketing, Desk Research, Prioritization
Understanding your target audience is vital to business success. How can you market yourself effectively if you don’t know who you’re targeting? Using the Target Audience template, you can review valuable data about who your customers are and what they want from your product or service.