Bar Chart / Diagram Combined
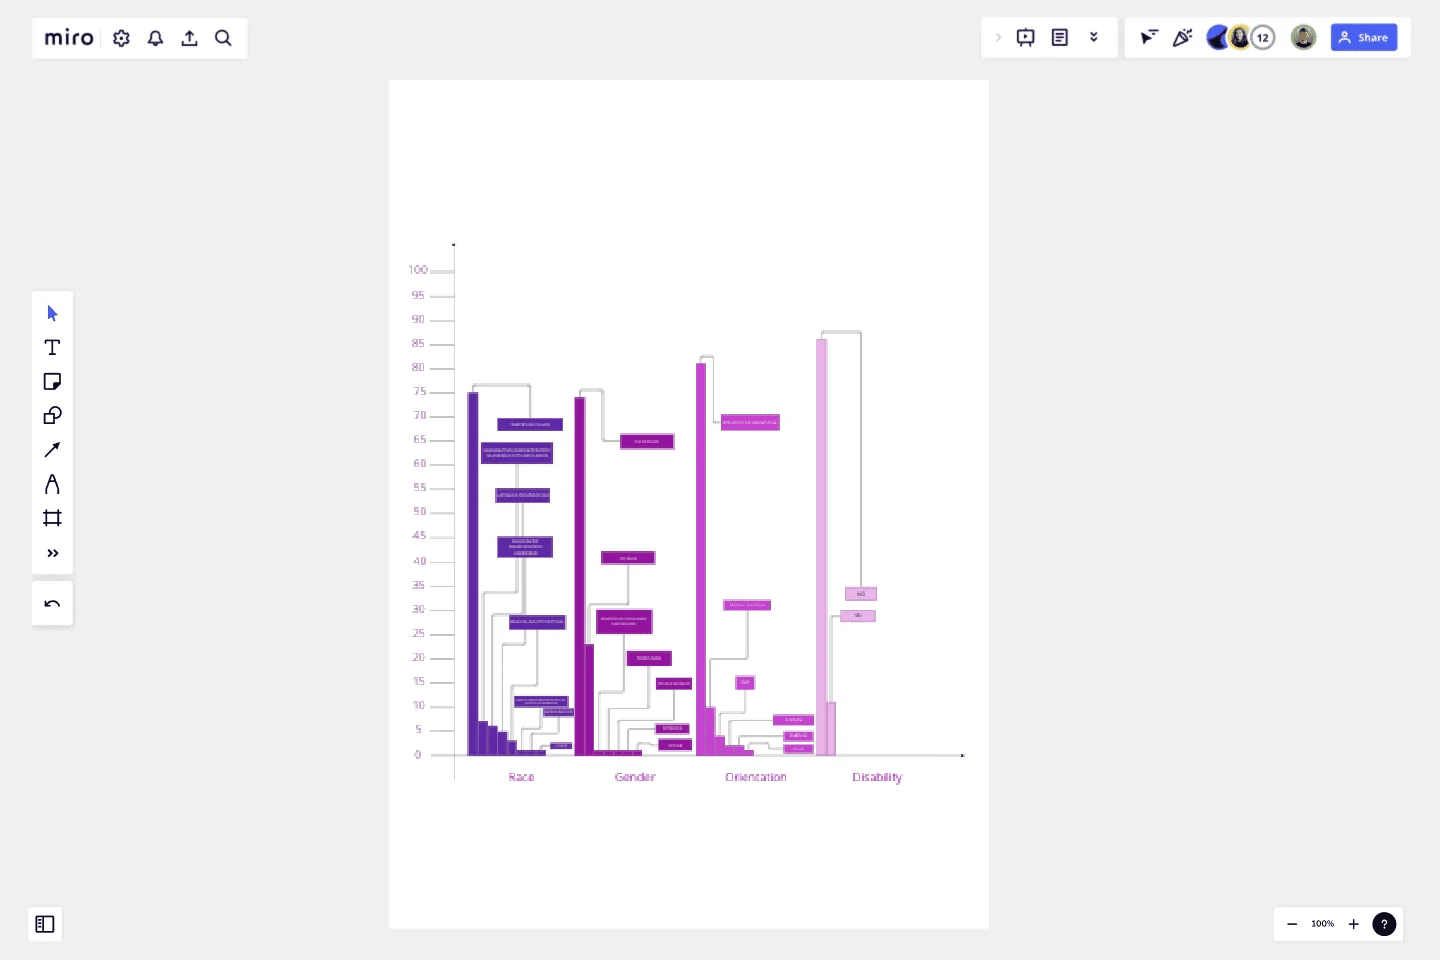
The template is about a bar chart that helps blend multiple/diverse datas.
The template is about a bar chart that helps blend multiple/diverse datas. It is for everyone especially to students and companies that prefer to wrap up more information at once.
Anyone can click on the bars, numbers and lines to change colour, number, text and add more of these items listed above.
Get started with this template right now.
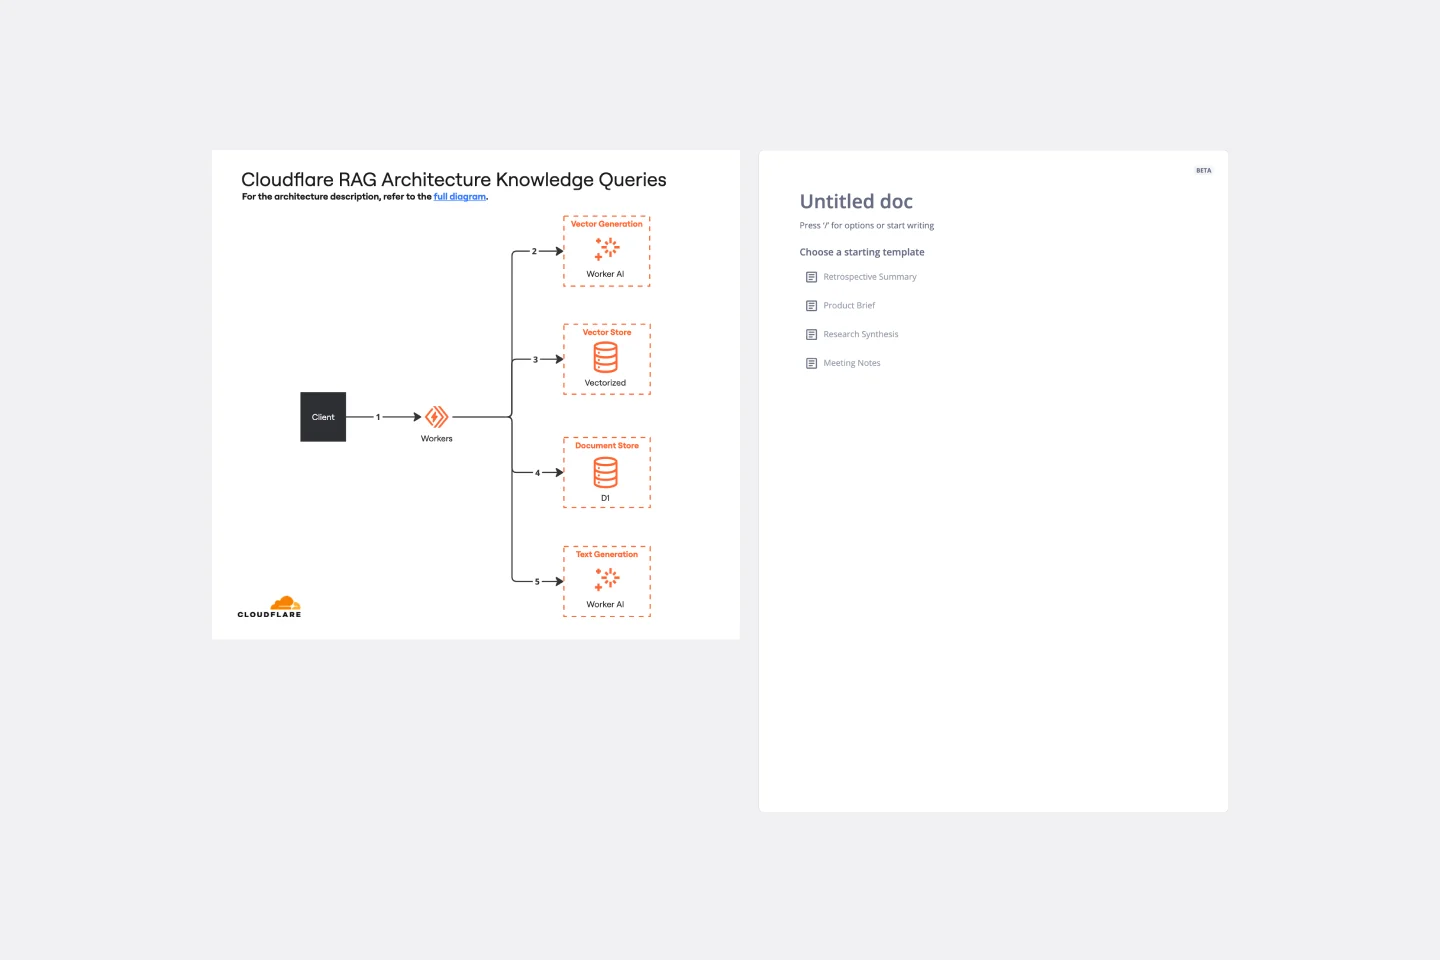
Cloudflare RAG Architecture Knowledge Queries Template
The Cloudflare RAG Architecture Knowledge Queries template is a cutting-edge tool designed to streamline the process of diagramming and understanding the intricate architecture of Cloudflare's Retrieval Augmented Generation (RAG) system. This template is a boon for teams aiming to visualize, query, and optimize Cloudflare's infrastructure collaboratively.
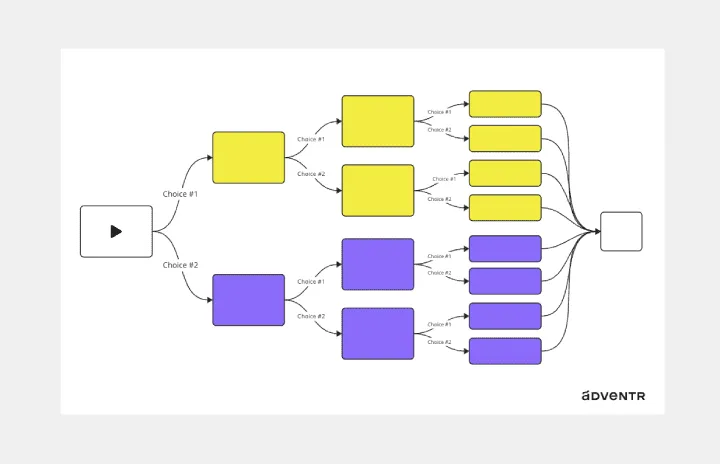
Interactive Video Storyboard Canvas
Works best for:
Diagramming
The Interactive Video Storyboard Canvas template offers a visual framework for planning and storyboarding interactive video content. It provides elements for outlining scenes, defining interactions, and visualizing user pathways. This template enables teams to design engaging and immersive video experiences, facilitating collaboration and alignment among content creators and stakeholders. By promoting creativity and interactivity, the Interactive Video Storyboard Canvas empowers teams to create compelling video narratives that captivate audiences and drive engagement.
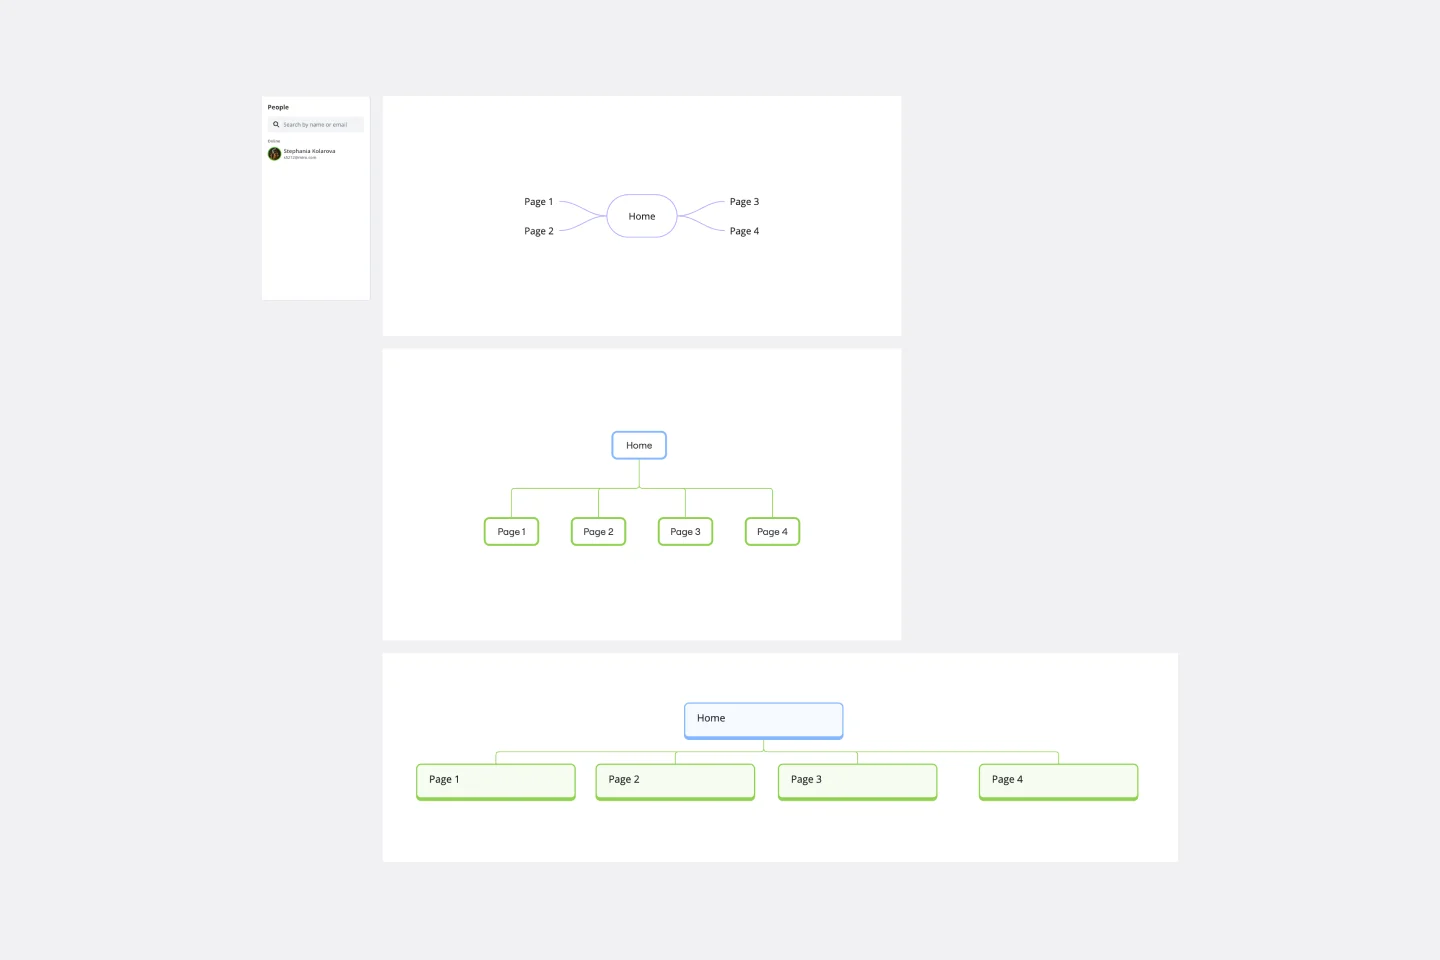
Sitemap Template
Works best for:
Mapping, Software Development, Diagrams
Building a website is a complex task. Numerous stakeholders come together to create pages, write content, design elements, and build a website architecture that serves a target audience. A sitemap is an effective tool for simplifying the website design process. It allows you to take stock of the content and design elements you plan to include on your site. By visualizing your site, you can structure and build each component in a way that makes sense for your audience.
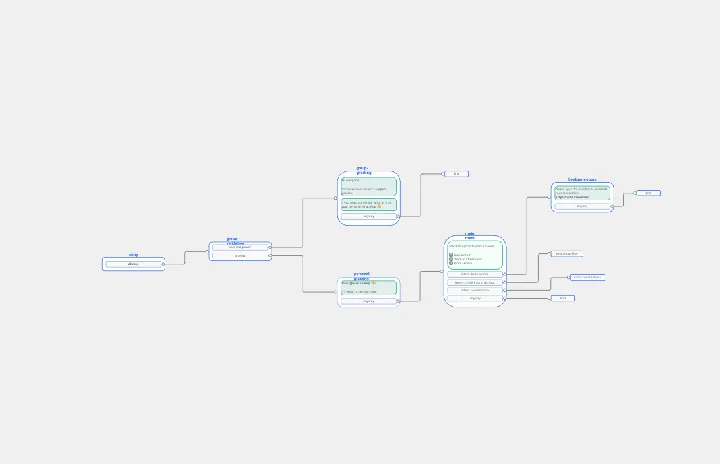
Chat-Bot
Works best for:
Diagramming
The Chat Bot template is a visual tool for designing and mapping out chatbot interactions and functionalities. It provides a structured framework for visualizing conversation flows, user inputs, and bot responses. This template enables teams to collaborate on designing chatbot experiences that are intuitive and user-friendly, driving engagement and satisfaction. By promoting clarity and alignment, the Chat-Bot template empowers organizations to create effective chatbot solutions that meet user needs and business objectives.
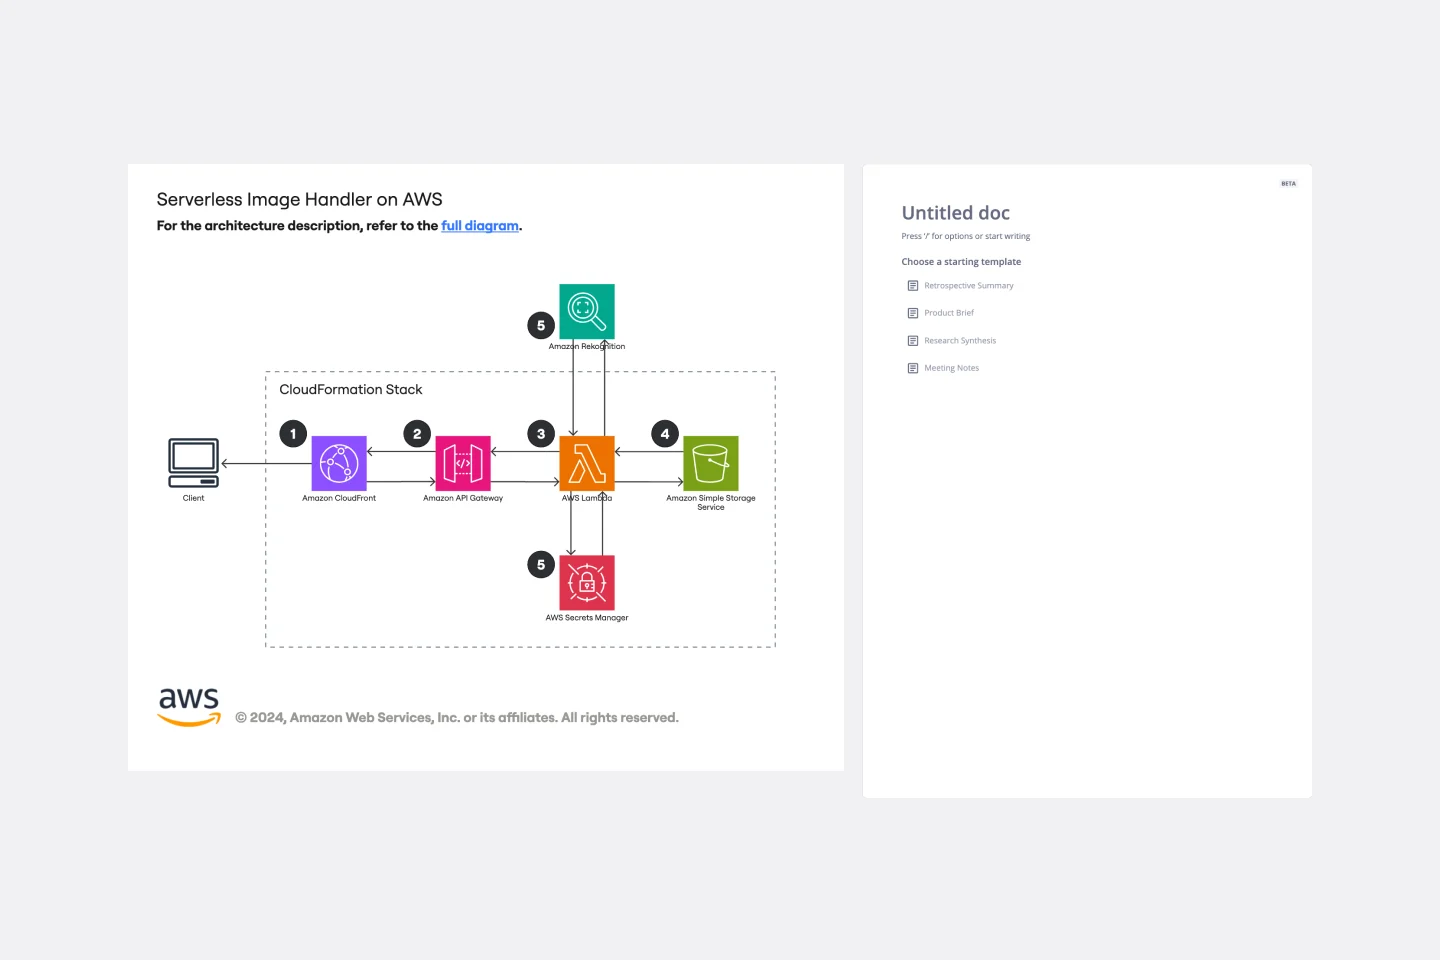
Serverless Image Handler on AWS Template
Works best for:
AWS
The Serverless Image Handler on AWS template is designed to facilitate the management and transformation of images in cloud-based projects without the need for server infrastructure management. It is particularly useful for applications and projects that require dynamic image management, offering benefits like efficiency, scalability, and seamless integration with AWS services. By incorporating this template into Miro boards or projects, teams can streamline their workflows, especially when dealing with digital assets or dynamic content, ensuring that their image-handling needs are met efficiently as they scale.
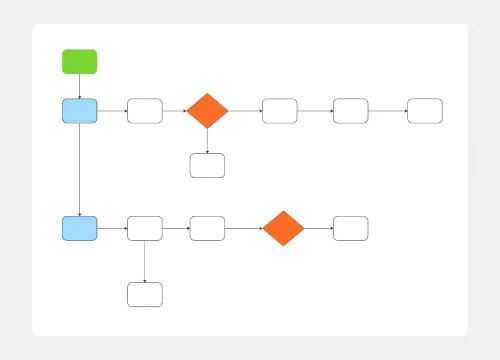
20/80 Process Diagram - EOS® Compatible
Works best for:
Diagramming
The 20/80 Process Diagram - EOS® Compatible template is a visual tool for mapping out processes and workflows aligned with the Entrepreneurial Operating System (EOS®) methodology. It provides a structured framework for identifying core processes and key activities that drive business outcomes. This template enables organizations to streamline operations, clarify roles and responsibilities, and enhance accountability. By promoting alignment with EOS® principles, the 20/80 Process Diagram empowers teams to achieve organizational excellence and drive sustainable growth.