
8 Different Ways to Organize Your Backlog
Try out the best backlog organization practices!
Often we don’t question our product backlogs, they’re a list of stuff we hope, might and would like to do, but do they always have to be represented as a list?
The 8 Different Ways to Organize Your Backlog
1. User Story Map
Backlog as a User Story Map
User Story Maps are a great way to quickly build out your backlog for the first time, it’s also a powerful tool for release planning.
For more mature products I’ve often split my user story map by customer archetype, JTBD, objectives and even problem spaces, depending on what makes the most sense.
2. Idea Funnel Backlog
Idea Funnel Backlog feeding into a Kanban board
Literally a funnel! A great way to visualise your backlog and to actually physically restrict the number of product backlog items that are at the “top” (well “right”) of the backlog.
This form of backlog is great to help with prioritisation and focus whilst also keeping things fluid without too much overhead or formal structure.
3. Opportunity Backlog
Splitting your backlog into two — Opportunity backlog for discovery and Development for delivery.
All the ideas, problem spaces, and opportunities are thrown in here, if validated as a good idea they graduate to the delivery backlog.
And eventually the learning will lead to more opportunities and thus making its way back into the Opportunity backlog and that’s the circle of Product Development!
4. Classes of Work Backlog
Divide your backlog into multiple smaller backlogs based on different classes of work.
What often happens is that in order to keep track of everything product managers go labeling-crazy. When you think about it what they are actually doing is dividing their backlog into multiple smaller backlogs based on different classes of work.
One simple thing to do is to literally separate them. Most tools will allow you to achieve this using different views and filters whilst keeping the integrity of a single view for things like your sprints.
5. Tree Backlog
Tree backlogs are great for complex products with many different feature sets.
Technology Trees are great for complex products with many different types of features. Representing your backlog in this manner is a great way to visually show how different features inter-relate and how certain functionality can start out simple and incrementally be enhanced.
6. Impact Map Backlog
Impact maps are great for ideating many alternative paths towards a particular outcome.
Impact mapping works in a similar way to the Tree Backlog in the sense that it branches out. However, unlike the Tree each stage in the branch is not another backlog item rather it represents a stage in the impact map moving from the WHY > WHO > WHAT > HOW.
Representing your backlog this way is great for keeping everything outcome orientated. However impact mapping backlogs aren’t great at representing other classes of work such as technical debt, bug fixes, etc.
7. Circle Backlog
Circle backlogs are perfect for creating ‘slices’ to categorise your work whilst still maintaining a holistic view in one place.
There’s just something about breaking the mould — or perhaps it has to do with the lack of corners — that brings the creativity out in people.
You can even get creative and have different slice sizes, a great way to physically restrict WIP!And much like the Funnel Backlog they also can act as a roadmap + backlog in one.
8. Conversion Funnel Backlog
Conversion Funnel backlogs are great for early and growth stage products with clear conversions.
It brings two important pieces of information together, the quantitative data around drop-offs/potential pain-points in your funnel but also the backlog items/opportunity areas.
If there is a clear drop off at a particular point then everything within that section of the backlog is now your top priority. You get laser-focus, and you keep focusing on that section of the backlog until the numbers improve or if you get another compelling reason to focus on something else.
Get started with this template right now.

Agile Product Roadmap
Works best for:
Product Management, Roadmap
Enhance your agile workflow with the Agile Product Roadmap by HatchWorks. This template helps you plan and track product development in agile sprints, ensuring continuous delivery and improvement. Use it to align teams, prioritize features, and adapt quickly to changes. Ideal for agile teams aiming to maintain flexibility and efficiency in their product development process, ensuring timely and iterative delivery of enhancements.
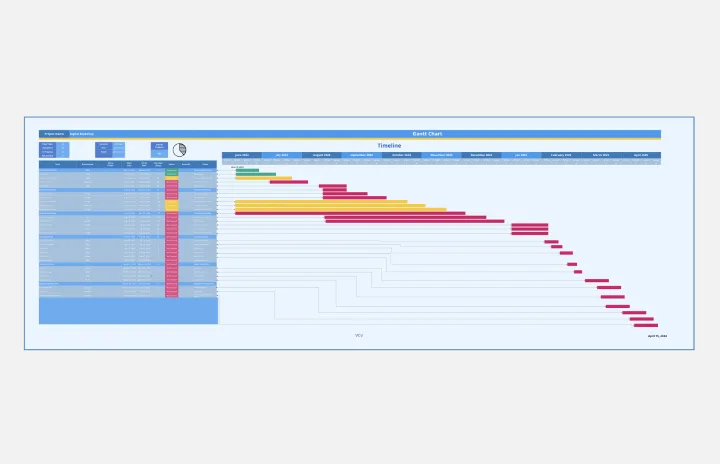
Gantt Chart Project
Works best for:
Strategy, Planning
The Gantt Chart Project template is a versatile tool for managing various types of projects. It provides a clear visual timeline of your project's tasks, deadlines, and dependencies. Use it to plan, execute, and monitor your project's progress, ensuring all activities are aligned and on track. This template enhances team collaboration, improves time management, and helps address potential bottlenecks for successful outcomes.
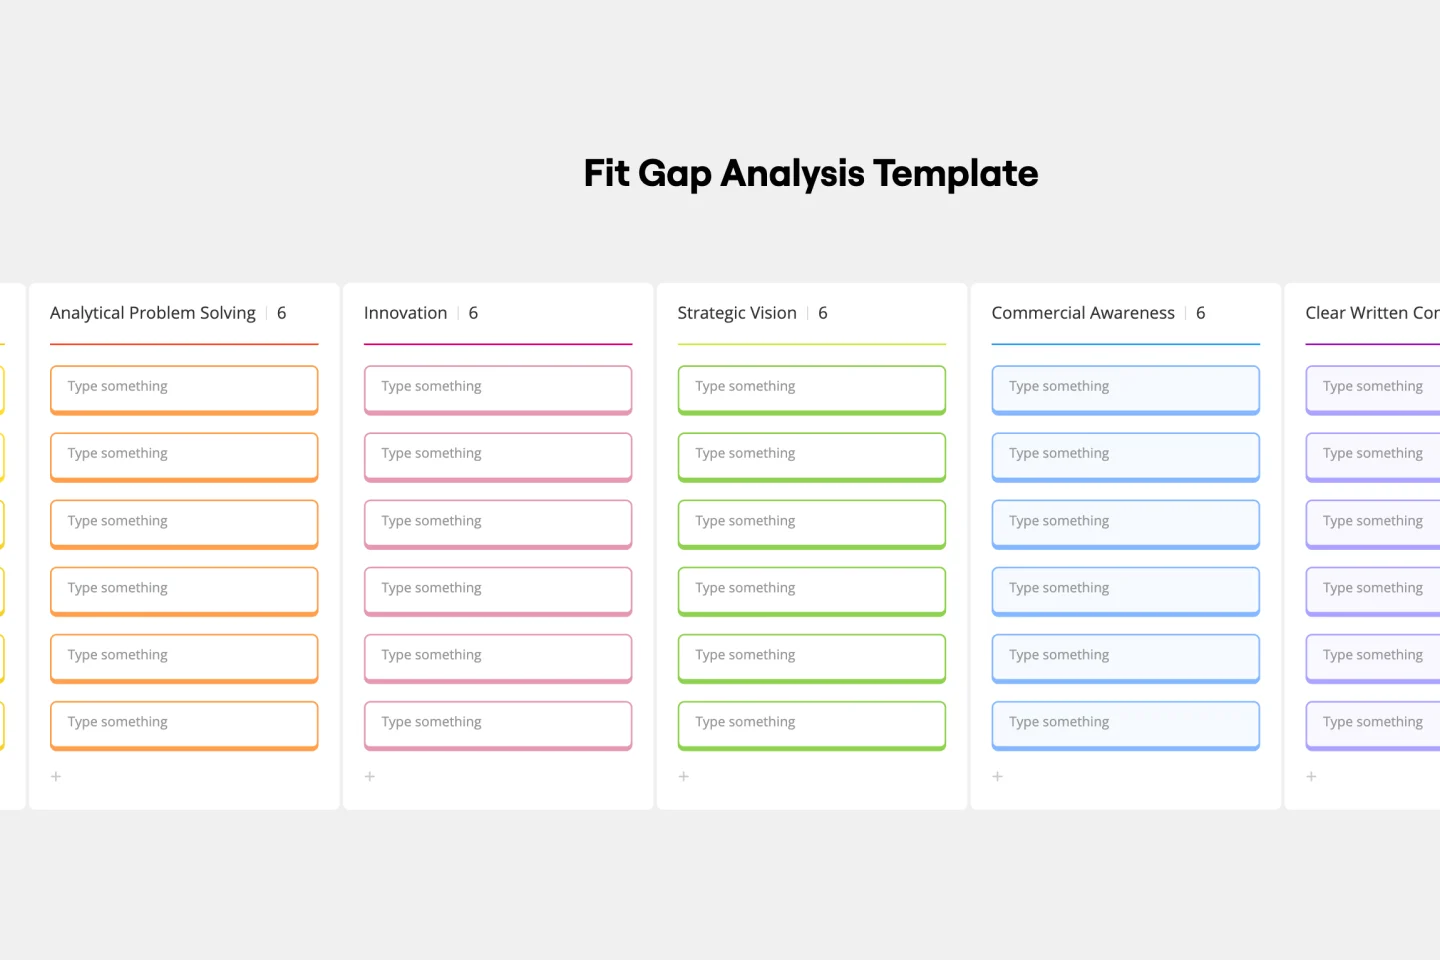
Fit Gap Analysis Template
Works best for:
Strategy, Planning, Management
The Fit Gap Analysis Template is a strategic tool designed to help teams and organizations identify discrepancies between their current state and desired outcomes. By visualizing these gaps, it offers a clear roadmap for improvement, allowing for a focused alignment of resources. One significant benefit of using this template is enhanced clarity; teams can visually discern where they currently stand and plot a precise path toward their goals, ensuring efficient decision-making and effective resource allocation.
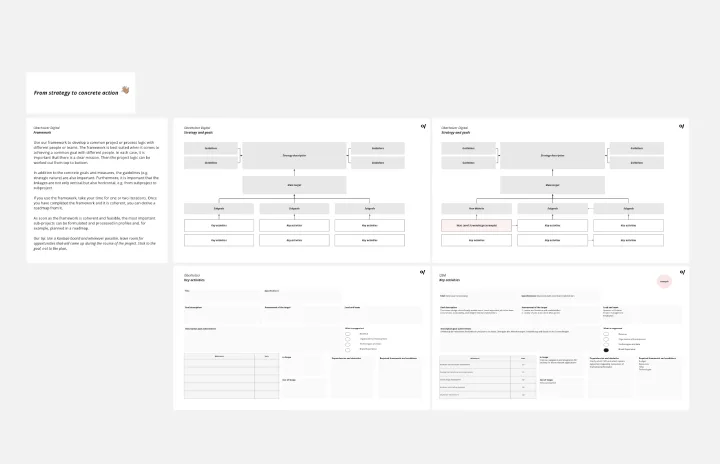
Strategic Action Framework
Works best for:
Roadmap, Planning, Mapping
The Strategic Action Framework template provides a structured approach for developing and implementing strategic initiatives. By defining goals, strategies, and action plans, teams can align their efforts with organizational objectives and drive progress towards desired outcomes. This template fosters collaboration and accountability, ensuring that strategic initiatives are executed effectively and deliver measurable results.
Timeline Meeting
Works best for:
Timeline, Planning
The Timeline Meeting template is tailored for planning and conducting meetings with a focus on time management. It helps you set clear agendas, allocate time for each topic, and keep track of discussion points. This template ensures your meetings are productive and stay on track.
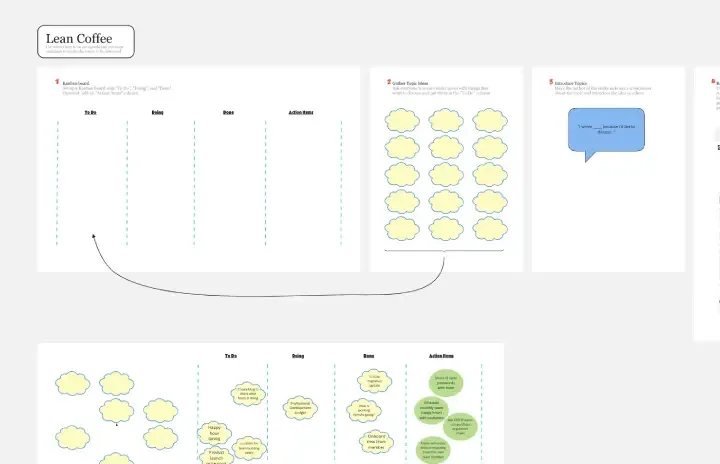
Lean Coffee: Meetings without Agendas
Works best for:
Agile
Lean Coffee: Meetings without Agendas is a collaborative meeting format that fosters open dialogue and emergent topics. Participants suggest discussion topics, vote on them, and engage in time-boxed conversations. This template provides a structured framework for facilitating Lean Coffee sessions, enabling teams to prioritize topics, share insights, and make decisions collectively. By promoting inclusivity and adaptability, Lean Coffee empowers teams to address issues efficiently and drive continuous improvement.